After completing my third project, I have learned a lot about training different models with my processed data, using those models to make predictions, and evaluating their performance; however, what I failed to fully grasp is how some of these models were actually doing all these amazing calculations in the background. So, I decided to do further investigation into 3 of the models without going too deeply into the math. My goal is to give simple descriptions—after all, the math is where most of our eyes glaze over.
Logistic Regression:

“Used when data is binary (two classes). Classifies data in one group versus another one; this model will assign a ‘probability’ of belonging to one group versus another one.”
When I read the above, it did not make a ton of sense, but after I looked up some other resources, I learned that it is similar to linear regression, except for it classifies data points in one or another class using probabilities. Instead of using residuals or how far off each data point is from the line of best fit, it uses maximum likelihood, or where the data points are more likely to follow the s-shaped line. Unlike linear regression, logistic regression can use continuous or discrete data like categories for the x-axis, but it can only use two classes for the y-axis (usually ‘yes’ or ‘no’). The huge benefit of this model is that you can easily change the probability threshold of this model to greater than or less than 50%. So, if for example you are trying to figure how who has a rare disease or not, you would use a higher probability, so there are less false negatives.
This this video for good interactive visual: https://www.youtube.com/watch?v=yIYKR4sgzI8&ab_channel=StatQuestwithJoshStarmer
Vector Support Machine:
 “A type of classifier which modifies the loss function for optimization to not only take into account overall accuracy metrics of the resulting predictions, but also to maximize the decision boundary between the data points. In essence, this further helps tune the classifier as a good balance between underfitting and overfitting. Another way of putting it is that it performs classification by finding the separation line or (in higher dimensions) “hyperplane” that maximizes the distance between two classes.”
Hyper-what? The only thing I took out of this is that it achieves a good balance between underfitting and overfitting which doesn’t give a lot of detail how. Understanding this took some time before I came across a really good resource that explained it simply. Basically, this model projects the data’s different features into a higher dimensional space to find a easier way to classify the data points. What does this mean? It means for example, if one of your features is weight, that value would be squared and placed on a y-axis assuming weight was already on the x-axis. Thus the 1 dimentional data is 2 dimentional. With this new data, we can classifer the data points more easily and predict how new data will be classified into two groups. This model can change 1 dimentional data to any higher dimention in order to find the way to separate the data points into two classifications that has the least number of misclassifications.
Take a look at the visuals from this video: https://www.youtube.com/watch?v=efR1C6CvhmE&app=desktop&ab_channel=StatQuestwithJoshStarmer
K-Nearest Neighbor:

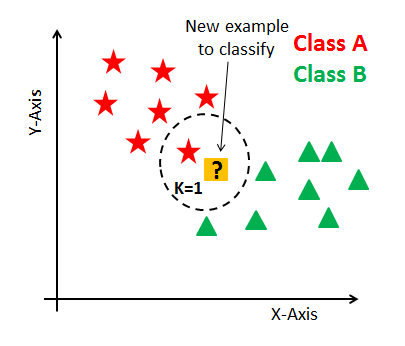
“An effective classification and regression algorithm that uses nearby points in order to generate a prediction.”
This makes some sense. But, let us think of this as a kind of voting system. Suppose we want our model to predict if someone is a tall or short person. So we have some people who have been defined as tall in one gorup and short in another. We then have a new person walk in, and we look at this person’s height in comparison one person from each group. If the tall person says, ‘he is about my height!’ he is putting in a vote that this new person is also tall. The short person says, ‘he is way taller than me,’ so does note vote for him being short. This goes on for each person in each group, and we tally up how many say he is tall and how many say he is short. The final tally will determine to which group he belongs.
And there you have it! Three models explained without math or too many terms. Please feel free to check out Josh Starmer. He is an incredible speaker with great visuals for these and other conceptally tough machine learning models.